Note
Go to the end to download the full example code.
Creating an Interactive Line Profile#
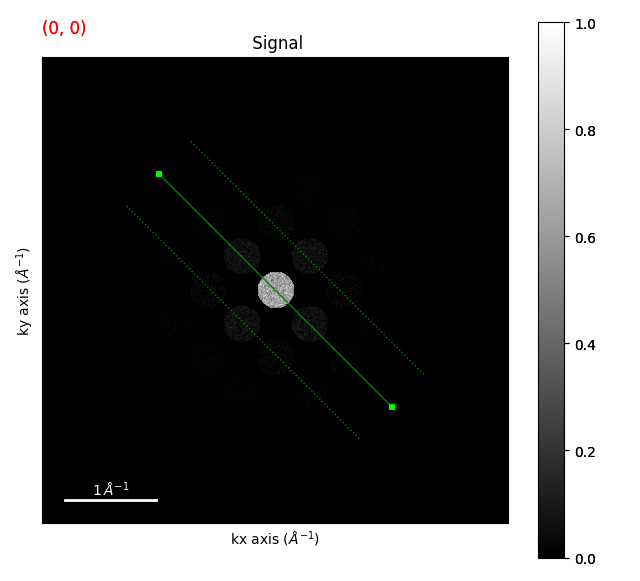
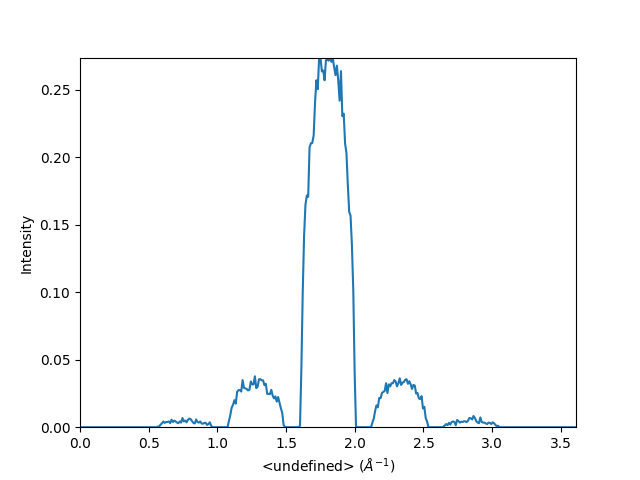
Many times we want to measure the distance between two disks in a diffraction pattern. A lot of times programming this is a bit of a pain. With HyperSpy’s interactive tools we can fairly easily create a line profile that we can interactively adjust to measure the distance between two disks in a diffraction pattern.
from pyxem.data import simulated_strain
import hyperspy.api as hs

strained_signal = simulated_strain(
    navigation_shape=(32, 32),
    signal_shape=(512, 512),
    disk_radius=20,
    num_electrons=1e5,
    strain_matrix=None,
    lazy=True,
)
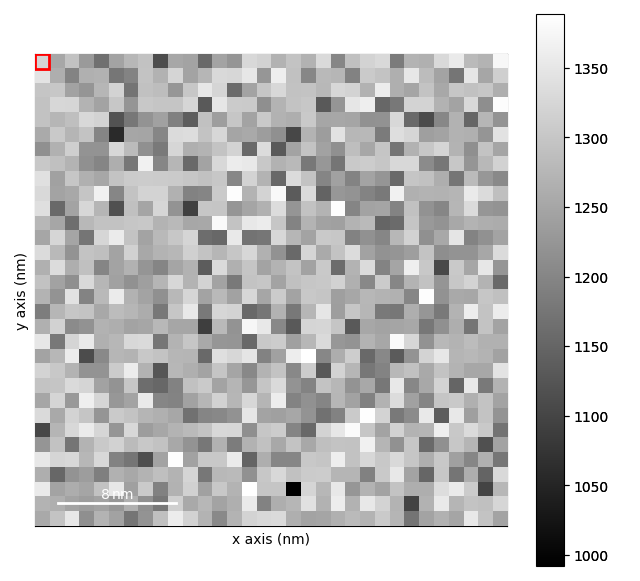
strained_signal.plot()
profile = strained_signal.add_interactive_line_profile(linewidth=1)
  0%|          | 0/65 [00:00<?, ?it/s]
100%|██████████| 65/65 [00:00<00:00, 1002.15it/s]
That’s it! For completeness, here is the code to create the interactive line profile. You might want to use or modify this code to create your own interactive line profiles. The interactive functionality is built into HyperSpy is pretty powerful but sometimes can be confusing and a little tricky to get right.
line_roi = hs.roi.Line2DROI(x1=-1, y1=-1, x2=1, y2=1, linewidth=1)

if (
    line_roi.update
    not in strained_signal.axes_manager.events.any_axis_changed.connected
):
    strained_signal.axes_manager.events.any_axis_changed.connect(line_roi.update, [])


def get_current_profile():
    return line_roi(strained_signal.get_current_signal())


profile = hs.interactive(
    get_current_profile,
    event=[
        line_roi.events.changed,
        strained_signal.axes_manager.events.indices_changed,
    ],
)
line_roi.add_widget(strained_signal, axes=(2, 3))
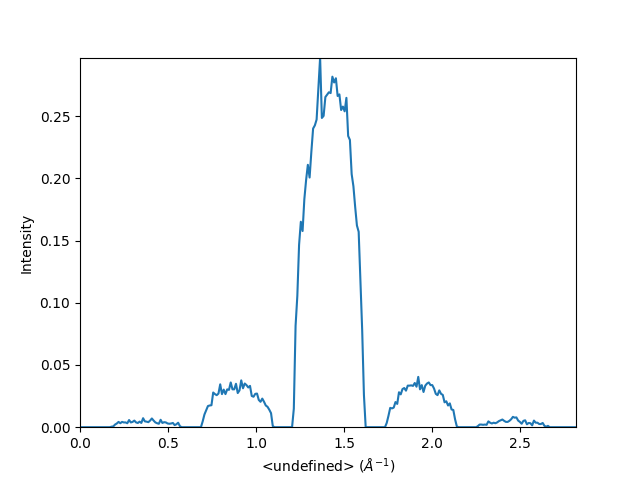
hs.plot.plot_spectra(
    [
        profile,
    ]
)

<Axes: xlabel='<undefined> ($\\AA^{-1}$)', ylabel='Intensity'>
sphinx_gallery_thumbnail_number = 3
Total running time of the script: (0 minutes 8.404 seconds)


