Note
Go to the end to download the full example code.
On Zone Orientation#
Sometimes you have a tilt boundary and you might want to know the orientation of the
grains on each side of the boundary. This can be done using the
pyxem.signals.PolarSignal2D.get_orientation() method.
For more information on the orientation mapping process see [CCAAnes+22]
from pyxem.data import si_tilt, si_phase
from diffsims.generators.simulation_generator import SimulationGenerator
from orix.quaternion import Rotation
from orix.vector import Vector3d

simulated_si_tilt = si_tilt()
Pre-Processing#
First we center the diffraction patterns and get a polar signal Increasing the number of npt_azim with give better polar sampling but will take longer to compute the orientation map The mean=True argument will return the mean pixel value in each bin rather than the sum this makes the high k values more visible
simulated_si_tilt.calibration.center = None
polar_si_tilt = simulated_si_tilt.get_azimuthal_integral2d(
    npt=100, npt_azim=360, inplace=False, mean=True
)
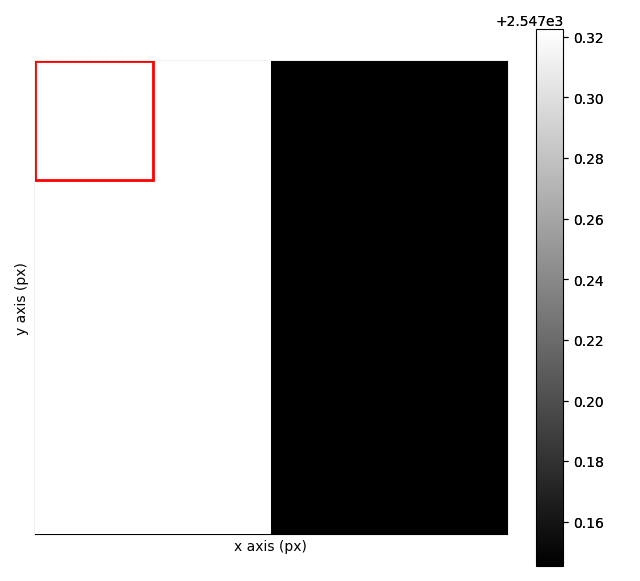
polar_si_tilt.plot()
  0%|          | 0/17 [00:00<?, ?it/s]
100%|██████████| 17/17 [00:00<00:00, 575.20it/s]
# Building a Simulation
# ---------------------
# Now we can get make the orientation map.  In this case we have aligned the tilt axis with the z-axis
# so we can use the :func:`orix.vector.Vector3d.from_euler` method to get the rotation axis.
# As always ``with_direct_beam=False`` is important to make sure that the center
# beam does not affect the orientation mapping.


phase = si_phase()
generator = SimulationGenerator(200)
sim = generator.calculate_diffraction2d(
    phase,
    rotation=Rotation.from_euler(
        [[0, 0, 0], [0, 0, 0]],
        degrees=True,
    ),
    max_excitation_error=0.1,
    reciprocal_radius=1.5,
    with_direct_beam=False,
)
# Getting the Orientation
# -----------------------
# This should be fairly good at finding the orientation of the grains on each side of the tilt boundary.
# The rotation is stored in the rotation column of the orientation map or .isg[2,0] if you want to use the
# rotation as a navigator or plot it directly.
polar_si_tilt = polar_si_tilt**0.5  # gamma correction

orientation_map = polar_si_tilt.get_orientation(sim)
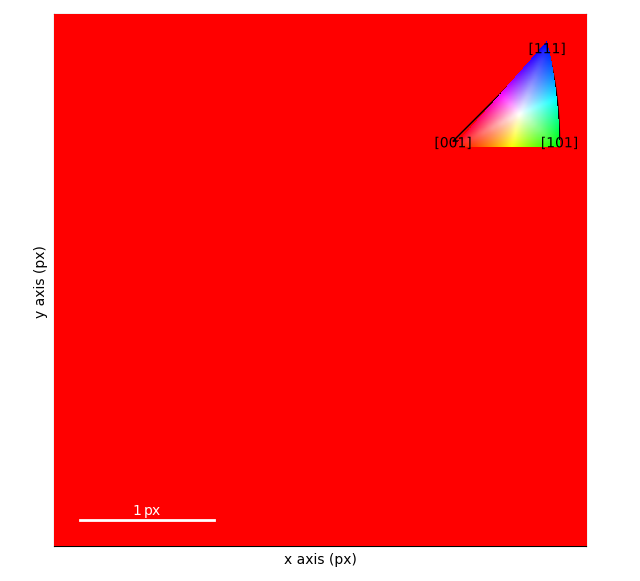
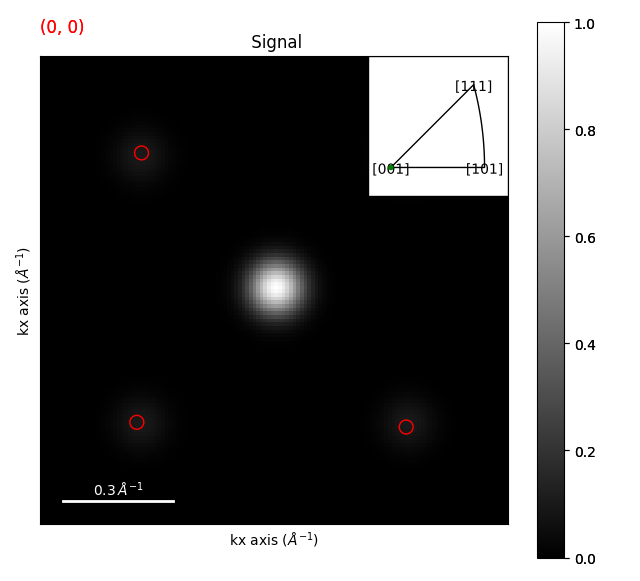
orientation_map.plot_over_signal(simulated_si_tilt)
  0%|          | 0/33 [00:00<?, ?it/s]
100%|██████████| 33/33 [00:00<00:00, 3040.02it/s]

  0%|          | 0/33 [00:00<?, ?it/s]
100%|██████████| 33/33 [00:00<00:00, 6619.42it/s]

  0%|          | 0/33 [00:00<?, ?it/s]
100%|██████████| 33/33 [00:00<00:00, 6642.61it/s]

  0%|          | 0/33 [00:00<?, ?it/s]
100%|██████████| 33/33 [00:00<00:00, 6794.56it/s]
Total running time of the script: (0 minutes 3.371 seconds)


