Note
Go to the end to download the full example code.
Magnetic DPC#
This example shows a basic workflow for doing magnetic DPC on a simple simulated test dataset. The dataset consists of alternating stripes of switching magnetic fields resulting in reversals of the direction of the magnetic field.
This is a generalization of some of the real datasets which are more completely analyzed in the longer Demo Notebooks.
import pyxem as pxm

s = pxm.data.simulated_stripes()

s_beam_pos = s.get_direct_beam_position(
    method="center_of_mass", half_square_width=20
)  # Just the center of the DP
  0%|          | 0/49 [00:00<?, ?it/s]
 65%|██████▌   | 32/49 [00:00<00:00, 314.18it/s]
100%|██████████| 49/49 [00:00<00:00, 254.14it/s]
Visualizing the Shifts#
The shifts can be visualized using the plot() method which shows both the
x and y shifts in a single plot.
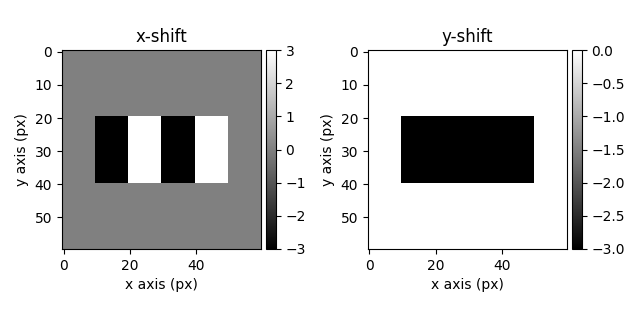
[<Axes: title={'center': 'x-shift'}, xlabel='x axis (px)', ylabel='y axis (px)'>, <Axes: title={'center': 'y-shift'}, xlabel='x axis (px)', ylabel='y axis (px)'>]
Visualizing the Shifts as color signal#
To plot the shifts in one signal, with the color showing the magnitude and direction.

Plotting Magnitude and Direction#
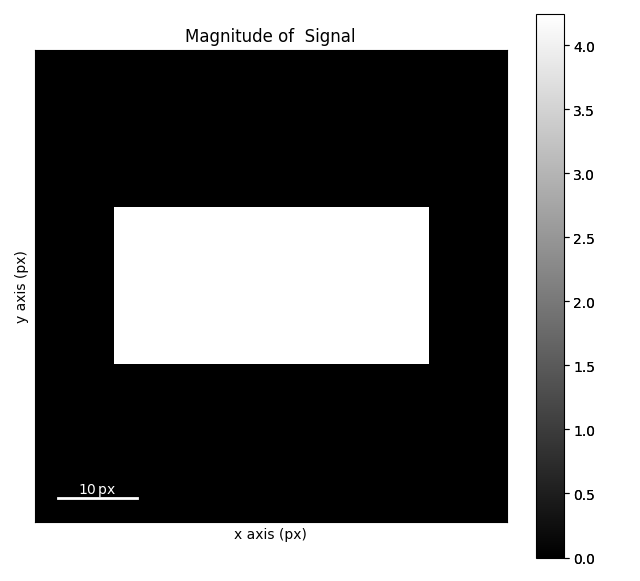
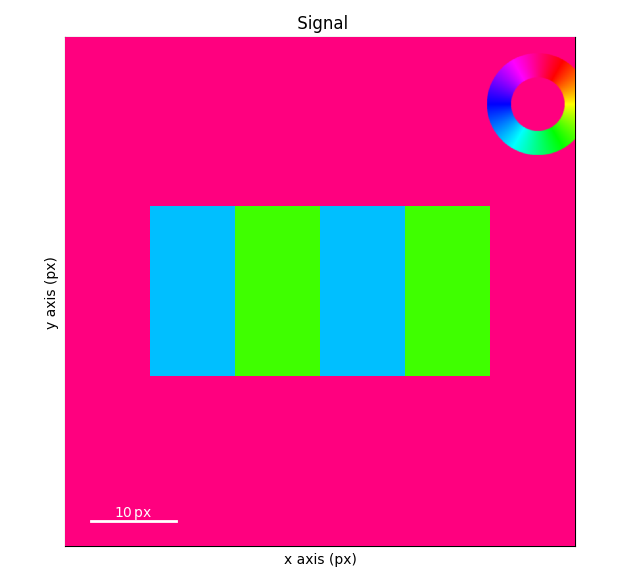
Since each probe position is a vector, we can plot the magnitude and phase (direction).
s_magnitude = s_beam_pos.get_magnitude_signal()
s_magnitude.plot()

s_phase = s_beam_pos.get_phase_signal()
s_phase.plot()
  0%|          | 0/33 [00:00<?, ?it/s]
100%|██████████| 33/33 [00:00<00:00, 3120.69it/s]
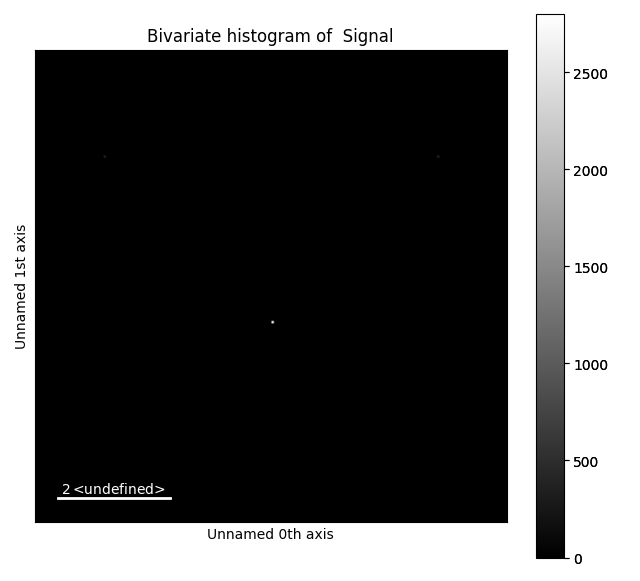
Plotting the bivariate histogram#
The shifts vectors can also be visualized as a histogram
s_hist = s_beam_pos.get_bivariate_histogram()
s_hist.plot()
Plotting with matplotlib#
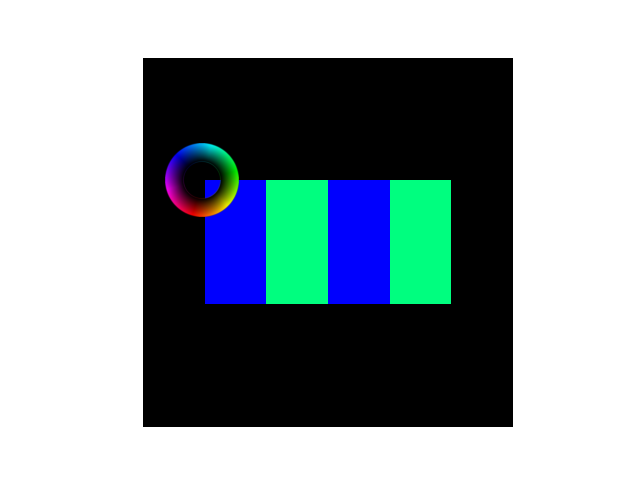
Pyxem also provides a convenient way to plot the magnitude and phase of the beam shifts using matplotlib. This is useful for creating publication-ready figures.
import matplotlib.pyplot as plt
from pyxem.utils.plotting import plot_beam_shift_color

fig, axs = plt.subplots(1, 1)
inset = axs.inset_axes([0.06, 0.57, 0.2, 0.2])
plot_beam_shift_color(
    s_beam_pos,
    phase_rotation=45,
    autolim=True,
    autolim_sigma=3,
    ax_indicator=inset,
    ax=axs,
)

fig, axs = plt.subplots(1, 1)
inset = axs.inset_axes([0.06, 0.57, 0.2, 0.2])
plot_beam_shift_color(
    s_beam_pos,
    phase_rotation=45,
    autolim=True,
    autolim_sigma=3,
    ax_indicator=inset,
    only_phase=True,
    ax=axs,
)

# sphinx_gallery_thumbnail_number = 3
<Figure size 640x480 with 1 Axes>
Total running time of the script: (0 minutes 1.765 seconds)

